Udemy - Data Visualization in Python (Mplib, Seaborn, Plotly, Dash)

seeders: 16
leechers: 7
updated:

Download Fast Safe Anonymous
movies, software, shows...
  • Downloads: 64
  • Language: English

Files

[ DevCourseWeb.com ] Udemy - Data Visualization in Python (Mplib, Seaborn, Plotly, Dash)
  • Get Bonus Downloads Here.url (0.2 KB)
  • ~Get Your Files Here ! 1. Welcome
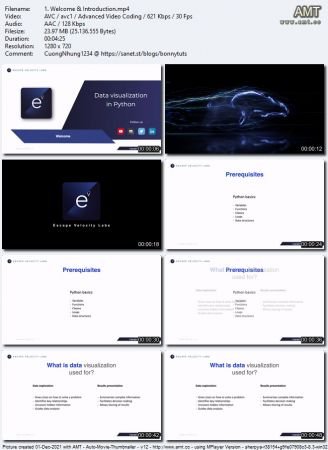
    • 1. Welcome & Introduction.mp4 (24.0 MB)
    • 1. Welcome & Introduction.srt (6.1 KB)
    • 1.1 Facebook.html (0.1 KB)
    • 1.2 Medium.html (0.1 KB)
    • 1.3 Twitter.html (0.1 KB)
    • 1.4 Website.html (0.1 KB)
    • 1.5 Youtube channel.html (0.1 KB)
    • 2. Setting up the environment.mp4 (6.3 MB)
    • 2. Setting up the environment.srt (2.1 KB)
    • 2.1 Link to our programming environment.html (0.2 KB)
    10. Data exploration with Plotly Wind dataset
    • 1. Polar charts.mp4 (6.1 MB)
    • 1. Polar charts.srt (1.6 KB)
    • 2. Presentation and loading of the dataset.mp4 (4.8 MB)
    • 2. Presentation and loading of the dataset.srt (3.1 KB)
    • 3. Which way is the wind blowing With what intensity.mp4 (67.0 MB)
    • 3. Which way is the wind blowing With what intensity.srt (10.3 KB)
    11. Data exploration with Plotly FMRI
    • 1. Presentation and loading of the dataset.mp4 (11.3 MB)
    • 1. Presentation and loading of the dataset.srt (2.7 KB)
    • 2. How does the brain react to certain events.mp4 (52.2 MB)
    • 2. How does the brain react to certain events.srt (6.2 KB)
    12. Data exploration with Plotly Stocks
    • 1. Presentation and loading of the dataset.mp4 (30.5 MB)
    • 1. Presentation and loading of the dataset.srt (4.1 KB)
    • 2. How have the stock prices evolved.mp4 (23.8 MB)
    • 2. How have the stock prices evolved.srt (2.8 KB)
    2. Matplotlib
    • 1. A brief introduction to matplotlib.mp4 (10.7 MB)
    • 1. A brief introduction to matplotlib.srt (2.8 KB)
    • 1.1 Learn the basics of NumPy (free).html (0.1 KB)
    • 10. Draw lines on the graph.mp4 (10.8 MB)
    • 10. Draw lines on the graph.srt (2.3 KB)
    • 11. Manipulate the axes of the graph.mp4 (36.9 MB)
    • 11. Manipulate the axes of the graph.srt (7.2 KB)
    • 2. Line Plot.mp4 (5.8 MB)
    • 2. Line Plot.srt (1.9 KB)
    • 3. Our first graph.mp4 (19.7 MB)
    • 3. Our first graph.srt (4.3 KB)
    • 4. Anatomy of a figure in matplotlib.mp4 (25.1 MB)
    • 4. Anatomy of a figure in matplotlib.srt (3.9 KB)
    • 5. The Figure and Axes classes.mp4 (13.8 MB)
    • 5. The Figure and Axes classes.srt (2.6 KB)
    • 6. Pyplot.mp4 (12.8 MB)
    • 6. Pyplot.srt (7.2 KB)
    • 7. Object-oriented interface.mp4 (39.3 MB)
    • 7. Object-oriented interface.srt (6.4 KB)
    • 8. Add annotations to the graph.mp4 (43.1 MB)
    • 8. Add annotations to the graph.srt (6.8 KB)
    • 9. Draw shapes on the graph.mp4 (26.4 MB)
    • 9. Draw shapes on the graph.srt (5.0 KB)
    3. Data exploration with matplotlib Iris dataset
    • 1. Dataset presentation.mp4 (20.3 MB)
    • 1. Dataset presentation.srt (4.4 KB)
    • 10. Box Plot.mp4 (11.2 MB)
    • 10. Box Plot.srt (3.6 KB)
    • 11. What is the range of values for each feature.mp4 (15.9 MB)
    • 11. What is the range of values for each feature.srt (2.5 KB)
    • 12. Violin Plot.mp4 (7.5 MB)
    • 12. Violin Plot.srt (2.7 KB)
    • 13. Feature value distribution.mp4 (47.8 MB)
    • 13. Feature value distribution.srt (8.6 KB)
    • 14. Bar chart.mp4 (4.2 MB)
    • 14. Bar chart.srt (1.3 KB)
    • 15. Multiple graphs.mp4 (8.1 MB)
    • 15. Multiple graphs.srt (2.1 KB)
    • 16. Do different species have different features.mp4 (71.0 MB)
    • 16. Do different species have different features.srt (9.9 KB)
    • 17. Global styles.mp4 (14.0 MB)
    • 17. Global styles.srt (2.4 KB)
    • 2. Loading the dataset.mp4 (27.6 MB)
    • 2. Loading the dataset.srt (5.0 KB)
    • 3. Pie chart.mp4 (6.3 MB)
    • 3. Pie chart.srt (1.9 KB)
    • 4. How many records of each class do we have.mp4 (31.0 MB)
    • 4. How many records of each class do we have.srt (4.5 KB)
    • 5. Modifying the style of the chart.mp4 (20.4 MB)
    • 5. Modifying the style of the chart.srt (3.0 KB)
    • 6. Scatter plot.mp4 (7.6 MB)
    • 6. Scatter plot.srt (2.1 KB)
    • 7. Can we differentiate the species by their petals.mp4 (33.9 MB)
    • 7. Can we differentiate the species by their petals.srt (6.7 KB)
    • 8. 3D Plots.mp4 (8.9 MB)
    • 8. 3D Plots.srt (2.0 KB)
    • 9. Does it help to know the length of the sepal.mp4 (39.5 MB)
    • 9. Does it help to know the length of the sepal.srt (6.2 KB)
    4. Image manipulation with matplotlib
    • 1. Using images in matplotlib.mp4 (19.5 MB)
    • 1. Using images in matplotlib.srt (2.9 KB)
    • 2. Grayscale vs RGB.mp4 (27.8 MB)
    • 2. Grayscale vs RGB.srt (2.9 KB)
    • 3. Color maps.mp4 (55.1 MB)
    • 3. Color maps.srt (5.4 KB)
    • 4. Creating complex graph structures.mp4 (43.5 MB)
    • 4. Creating complex graph structures.srt (6.0 KB)
    • 5. Creating color histograms for an image.mp4 (54.2 MB)
    • 5. Creating color histograms for an image.srt (7.6 KB)
    • 6. Increasing image resolution.mp4 (13.7 MB)
    • 6. Increasing image resolution.srt (2.3 KB)
    • 7. Saving images or graphs to a local file.mp4 (4.1 MB)
    • 7. Saving images or graphs to a local file.srt (0.9 KB)
    5. Seaborn
    • 1. Introduction to Seaborn.mp4 (3.6 MB)
    • 1. Introduction to Seaborn.srt (1.0 KB)
    • 2. Figure level and axes level graphs.mp4 (25.0 MB)
    • 2. Figure level and axes level graphs.srt (4.0 KB)
    • 3. The FacetGrid and AxesSubplot classes.html (0.1 KB)
    • 4. Pandas DataFrames.mp4 (6.3 MB)
    • 4. Pandas DataFrames.srt (2.5 KB)
    • 5. Modifying the style of the graphs.mp4 (34.2 MB)
    • 5. Modifying the style of the graphs.srt (7.4 KB)
    6. Data exploration with Seaborn Titanic dataset

Description

Data Visualization in Python (Mplib, Seaborn, Plotly, Dash)


https://DevCourseWeb.com

MP4 | Video: h264, 1280x720 | Audio: AAC, 44.1 KHz, 2 Ch
Genre: eLearning | Language: English + srt | Duration: 68 lectures (4h 23m) | Size: 1.41 GB
Master data visualization in Python with the matplotlib, seaborn, plotly and dash libraries
What you'll learn:
Explore data sets visually in Python.
Create web interfaces to visually present results.
Master the most important Python data visualization libraries (matplotlib, seaborn, plotly and dash).
Synthesize data sets for presentation to non-technical audiences.

Requirements
Very basic Python knowledge.

Description
Learn how to synthesize complex data sets easily in a visual way. In this course, you will develop this basic data science skill (data visualization) by exploring real data sets with the most popular Python tools (matplotlib, seaborn, plotly, and dash). You will learn how to extract the most relevant information from data and present it with a variety of graphs and charts to non-technical people.

Learn how to extract visual knowledge from complex data for decision-making with Python.


Download torrent
1.5 GB
seeders:16
leechers:7
Udemy - Data Visualization in Python (Mplib, Seaborn, Plotly, Dash)


Trackers

tracker name
udp://tracker.torrent.eu.org:451/announce
udp://tracker.tiny-vps.com:6969/announce
http://tracker.foreverpirates.co:80/announce
udp://tracker.cyberia.is:6969/announce
udp://exodus.desync.com:6969/announce
udp://explodie.org:6969/announce
udp://tracker.opentrackr.org:1337/announce
udp://9.rarbg.to:2780/announce
udp://tracker.internetwarriors.net:1337/announce
udp://ipv4.tracker.harry.lu:80/announce
udp://open.stealth.si:80/announce
udp://9.rarbg.to:2900/announce
udp://9.rarbg.me:2720/announce
udp://opentor.org:2710/announce
µTorrent compatible trackers list

Download torrent
1.5 GB
seeders:16
leechers:7
Udemy - Data Visualization in Python (Mplib, Seaborn, Plotly, Dash)


Torrent hash: B0F9C2CD9031761BBD5A9B54C052D8DAAEC80BE2